Key Takeaways
- The average Google Ads click reached $5.42 in the latest WordStream benchmarks, up from $4.66 a year earlier, with costs rising in 87% of industries.
- Your cost to win one order is roughly cost per click divided by conversion rate. Small changes in either number move the result a lot.
- Typical online stores convert around 2% of visits into orders, and higher-priced products convert less.
- For a new product, advertising works best as a measuring tool first and a sales engine second.
“If you build it, they will come” was never true of online stores. Someone has to bring the visitors, and for a product nobody has heard of, that usually means paying for attention or earning it slowly through content.
Knowing what that attention costs is one of the most useful things a new inventor can learn, ideally before spending much of it.
What Does a Click Cost in 2026?
Every year the advertising software company WordStream publishes benchmarks drawn from thousands of US search advertising campaigns. Search Engine Land’s summary of the latest report, published in May 2026, put the numbers this way:
- The average cost per click was $5.42, up from $4.66 the year before.
- 87% of industries saw their click costs rise.
- The report’s own conclusion: rising costs mean “advertisers can no longer rely on volume alone to drive performance.” Better targeting, creative, and landing pages now decide who stays profitable.
A caveat is in order. Those figures cover Google search ads across 23 industries, including expensive ones like legal and home services. Clicks from social platforms are often cheaper, and costs vary widely by product and audience. The direction of travel, though, is the same everywhere: attention costs more than it used to.
The Math Every Inventor Should Know
Two numbers determine what you pay to win one order through advertising.
- Cost per click (CPC): what you pay each time someone visits from an ad.
- Conversion rate: the percentage of visits that turn into an order.
Divide the first by the second and you have your approximate cost per order.
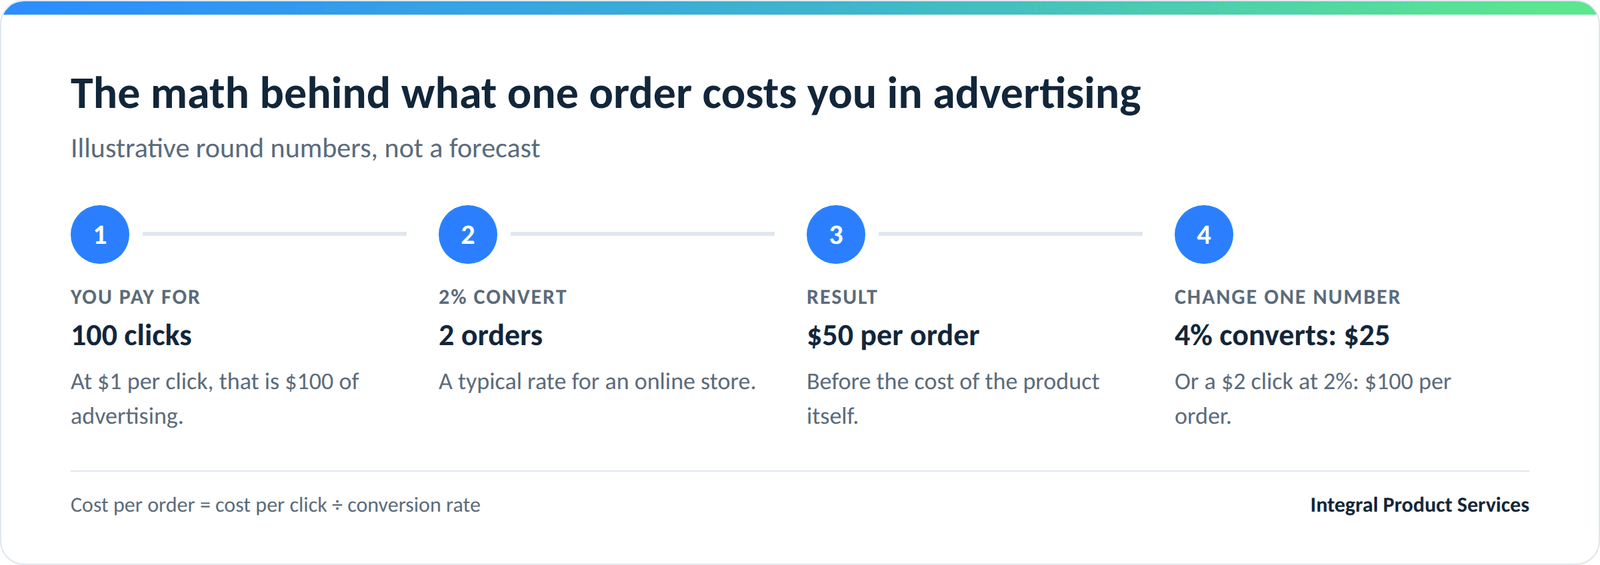
Here is an illustration with round numbers, not a forecast. Say a click costs you $1 and 2% of visitors buy. You pay for 100 clicks to get 2 orders, so each order costs about $50 in advertising. If your product sells for $40, you lose money on every sale before you have paid for the product itself.
Now change one number. If 4% of visitors buy, the cost per order drops to $25. If the click costs $2 instead of $1, it doubles to $100. This is why two products with similar appeal can have completely different economics.
What Is a Normal Conversion Rate?
A 2026 benchmark study by DTC Pages, covering 179 million sessions across 21 established Shopify stores, found a median conversion rate of 2.07%. Price made a clear difference:
- Products under $60: about 2.4%
- $60 to $100: about 2.0%
- $100 to $200: about 1.6%
- Over $200: about 0.8%
These are established brands with reviews, returning customers, and polished sites. A brand-new product from an unknown name should expect to start lower. That is normal, and it is one more reason to find your own numbers before building a plan around someone else’s.
Why a Small Test Beats a Big Launch
Given all that, the worst way to find out your numbers is a large launch budget spent in a few weeks. The better way is a small, deliberate test designed to answer specific questions:
- Which audience responds? The people you designed it for, or a group you did not expect?
- Which message works? The problem it solves, the time it saves, or the way it looks?
- What does a visit cost? And what does an email signup or a pre-order cost?
- What happens at different prices? Does interest hold when the price goes up?
Each answer makes the next dollar work harder. A test like this also shows you what a big launch never will: whether the economics can work at all. If it takes $60 of advertising to sell a $35 product, no amount of scale fixes that. You need a different price, a different audience, a different channel, or a different plan such as licensing.
Paid Is Not the Only Route
Even among retailers earning more than $1 million, only 31% told Shopify in a late 2025 survey that paid advertising was their most effective growth strategy. The rest pointed elsewhere.
For a new product, the lower-cost routes include:
- Organic social content. Slower, but it costs time rather than money and tells you what people react to.
- An email list. Every signup is someone you can reach again for free.
- Search visibility. A clear, well-structured site can be found by people already looking for a solution.
Most realistic plans blend these. Paid ads buy fast, measurable answers. Organic channels build an audience you do not have to keep renting.
What This Means for the Bigger Decision
Understanding acquisition cost also clarifies the choice between selling a product yourself and licensing it. An established company already has customers, retail relationships, and distribution. It does not have to buy attention one click at a time the way a new brand does.
If your test shows strong interest but expensive acquisition, that is not a failure. It may be evidence that the product is worth more in the hands of a company that already owns the audience, and your test data helps make that case.
We should be plain about the limits. A test costs money and may show the numbers do not work. Based on what we have seen over our careers, and in our first few years as a company, that is still the cheapest place to learn it.
Want Help Finding Your Numbers?
At Integral Product Services, we set up the tracking and run small, measured market tests so inventors can see their real costs before making bigger commitments. To talk about your product, reply to our email or visit our contact page.
This article is general information, not financial advice. The figures quoted are industry benchmarks and illustrations, and your results will differ.