
Key Takeaways
- In a new product’s first 90 days, five numbers matter most: where visitors come from, how many sign up, how many add to cart or pre-order, what price they accept, and what each of those costs you.
- Established Shopify stores convert a median of about 2% of visits into orders. A new, unknown product will usually start below that.
- Most traffic is mobile. If your site is hard to use on a phone, your data is measuring the site, not the product.
- Small samples mislead. A few dozen visits cannot tell you anything. Decide in advance how much data you need before drawing conclusions.
Launching a test site and social accounts for a new product produces a flood of numbers almost immediately. Sessions, impressions, reach, bounce rate, engagement rate, click-through rate.
Most of it is noise, especially early. The skill is knowing which few numbers bear on the decision you are trying to make: is there enough interest, at a workable price, to justify the next step?
Setting Up Before You Start
You cannot read data you did not collect. Before any traffic arrives, a test needs a few things in place:
- Google Analytics on the site, to record visits and where they came from.
- Tag Manager and defined goals, so that key actions like email signups, add-to-carts, and pre-orders are counted as events rather than guessed at later.
- Platform analytics on each social account.
- A consented email list. Shopify’s 2026 trends report highlights the industry’s shift away from cookie-based tracking toward data customers knowingly share. An email address someone gave you is the most durable data you will own.
This setup is unglamorous and easy to get wrong. If it is misconfigured, you can run a test for weeks and have nothing reliable to show for it.
The Five Numbers That Matter
1. Traffic source. Where did visitors come from? Social, search, direct, or referral? This tells you which channels are working and whether visitors are strangers or people you already know.
2. Signup rate. Of the people who visited, how many left an email address? It is the lowest-commitment form of interest and your earliest signal.
3. Add-to-cart and pre-order rate. How many took a step toward buying? For context, a 2026 benchmark study by DTC Pages, covering 179 million sessions across 21 established Shopify stores, found a median add-to-cart rate of about 6% and a median conversion rate of 2.07%.
4. Price response. Does interest hold as the price changes? This is the number most inventors want and the hardest to get cleanly. It usually requires testing different prices over different periods.
5. Cost per result. If you spent money to drive traffic, what did each visit, signup, and order cost? This determines whether selling the product yourself could ever be profitable.
What Is Normal?
The same DTC Pages study offers a few useful reference points.
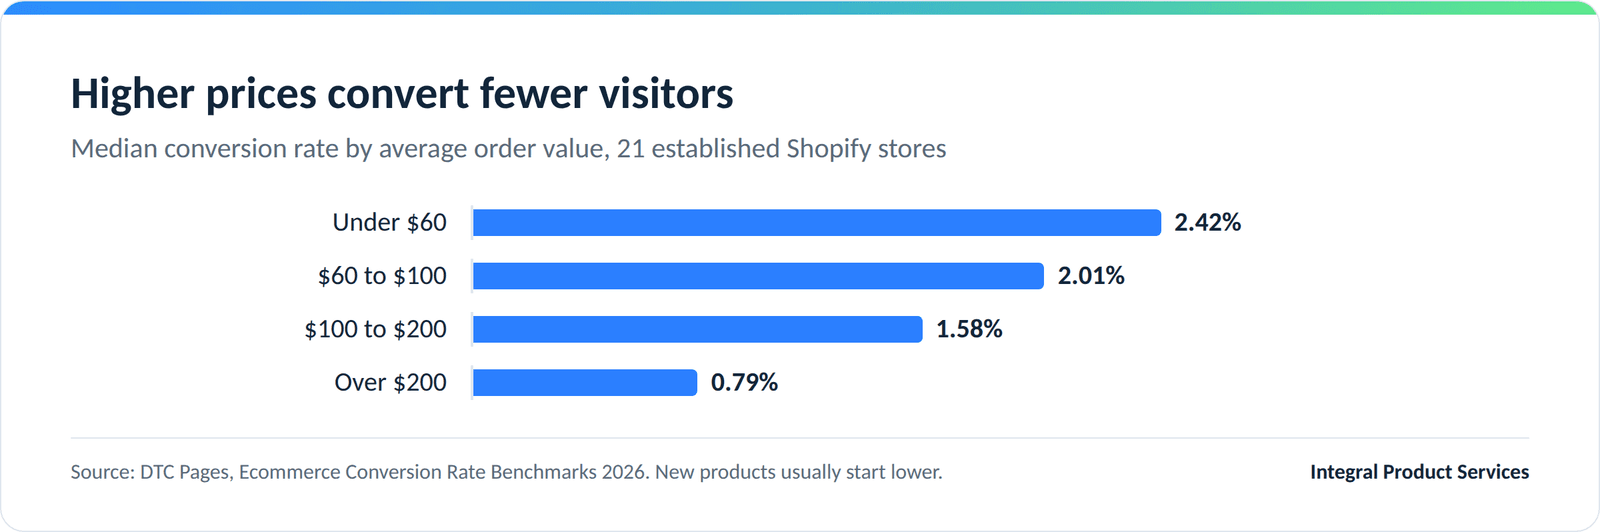
- Price lowers conversion. Products under $60 converted at a median 2.42%. Over $200, it was 0.79%.
- Mobile dominates. Phones accounted for 86% of traffic, yet converted at 2.29% against 3.74% on desktop.
- About half of checkouts are abandoned. The study measured 51.6%. People leaving at checkout is normal, not a verdict on your product.
Remember who is in that sample: established brands with reviews, repeat customers, and years of refinement. A first-time product from an unknown name should expect lower numbers at the start. Use benchmarks as a sense of scale, not a pass mark.
How to Avoid Fooling Yourself
Early data tempts people toward two errors. They see what they hope for, or they panic at a slow first week.
- Remove friends and family. Their visits and orders are support, not market evidence. Look at what strangers did.
- Respect sample size. If 40 people visited and 3 signed up, your signup rate is not reliably 7.5%. Three more or fewer would change the picture completely. As a rough guide, hold off on conclusions until a page has had at least several hundred visits from your target audience.
- Watch trends, not days. One viral post or one dead week tells you little. Compare month to month.
- Check the phone experience first. With most traffic on mobile, a slow or awkward mobile site will suppress every number. Fix that before you judge the product.
- Know about blind spots. Analytics are becoming less complete. Semrush notes, for example, that purchases completed through AI shopping assistants generate no pageviews at all. Treat your numbers as a good estimate rather than a perfect count.
What “Not Enough Data Yet” Looks Like
Sometimes the fair reading of a 90-day test is that it has not told you enough. Common signs:
- Traffic came mostly from people you know.
- Total visits are in the low hundreds.
- Only one price was ever shown.
- Tracking was broken for part of the period.
That is not failure. It means the test needs more time, more traffic, or a fix. It is far better to say “we don’t know yet” than to make a manufacturing or licensing decision on numbers that cannot bear the weight.
From Data to Decision
Once the data is solid, the patterns tend to fall into a few shapes.
- Strong interest at a workable price: a case for moving toward production, or a strong story for licensing outreach.
- Strong interest but costly to reach customers: may favor licensing to a company that already has the audience.
- Interest only at a low price: time to look hard at manufacturing cost.
- Little interest despite fair exposure: a hard result, but one that has saved you the cost of inventory.
Based on what we have seen over our careers, and in our first few years as a company, a process like this serves an inventor best when they are willing to accept any of those four answers.
Want Help Setting Up and Reading a Market Test?
At Integral Product Services, we set up analytics and tracking as part of every launch, so inventors can base their next step on evidence. To talk about your product, reply to our email or visit our contact page.